
Get Accurate Roof Waterproofing Cost Per Square Meter In South Africa Today And Protect Your Roof Fast In Johannesburg, Sandton & Midrand
Understanding roof waterproofing cost per square meter in South Africa can give you a national benchmark to use today. Typical quotes range widely by system—torch‑on, liquid coatings, cool‑roof treatments, and single‑ply membranes each sit at different price points. We show system examples and a realistic national band so you can compare like‑for‑like from the start.

Headline figures never tell the whole story. Labour, access, substrate condition and regional weather all shape the final cost per square metre that appears on a quote. We note typical job sizes (30–100 m² and larger) and explain how economy of scale can lower the unit price.
Later sections include clear tables for regional pricing, system pros and cons and sample budgets so you can make informed decisions quickly. We keep the language practical and friendly so you can choose the right solution with confidence – Contact Us
Buyer’s guide overview: how we help you make informed decisions today – Roof Waterproofing Cost Per Square Meter in South Africa
We set out exactly how to brief your project so competing quotes line up on the same scope and materials.
We recommend getting at least three itemised quotes. Ask each contractor to list preparation, primers, membrane or coating type, detailing and warranty terms. That makes comparisons fair and helps you make informed choices quickly.
Check credentials. Verify licences, insurance and trade membership. Call past clients and confirm local experience. Avoid bids that look unusually low; they often mean hidden extras later.

- Match services to your project type and exposure so quality is prioritised where it matters.
- Demand material transparency: brand, thickness and application rates.
- Plan maintenance and programme constraints like weather and curing times.
| Brief item | What to expect itemised | Why it matters |
|---|---|---|
| Preparation | Cleaning, repairs, priming | Needed for warranty validity and long life of materials |
| Materials | Brand, type, thickness, application rate | Lets you validate pricing and compare quality |
| Warranties & programme | Material and workmanship terms; weather windows | Protects value and avoids delays that raise final costs |
Quick checklist: like‑for‑like scope, itemised pricing, references checked, written warranties, and a clear maintenance plan. We will include more tables ahead to simplify comparisons and shortlist suitable options in minutes.
Current Roof Waterproofing Cost Per Square Meter in South Africa
Here is a national snapshot of typical rates and what those figures actually mean.

National price ranges at a glance (per m²): typical, low, and high
We show quick bands so you can benchmark any quote. Typical national range runs from R140–R500 per m² depending on the system and scope.
| Solution | Low (R/m²) | Typical (R/m²) | High (R/m²) |
|---|---|---|---|
| Liquid coatings | R140 | R140–R400 | R400 |
| Torch‑on | R300 | R300–R400 | R400 |
| Cool roof finish | R180 | R180–R500 | R500 |
| Single‑ply membrane | R280 | R280–R350 | R350 |
What’s included in a quote versus extras to watch for
Included: cleaning, priming, membrane or coating application and standard detailing. Labour often sits around R70–R250 per m² (average ~R160).
Extras: substrate repairs, flashing replacement, access equipment and removal of failed systems. These items commonly push a headline figure up to R400 or R500 per square allowances.
- Systems, material thickness and warranty length influence final pricing.
- Flat roofs usually need more layers and detailing, so costs vary accordingly.
- Ask for itemised quotes so you can compare exclusions and contingencies easily.
Regional pricing: provinces and major cities compared – Roof Waterproofing Cost Per Square Meter in South Africa
City-specific factors—labour rates, stock levels and weather—drive real-world pricing.
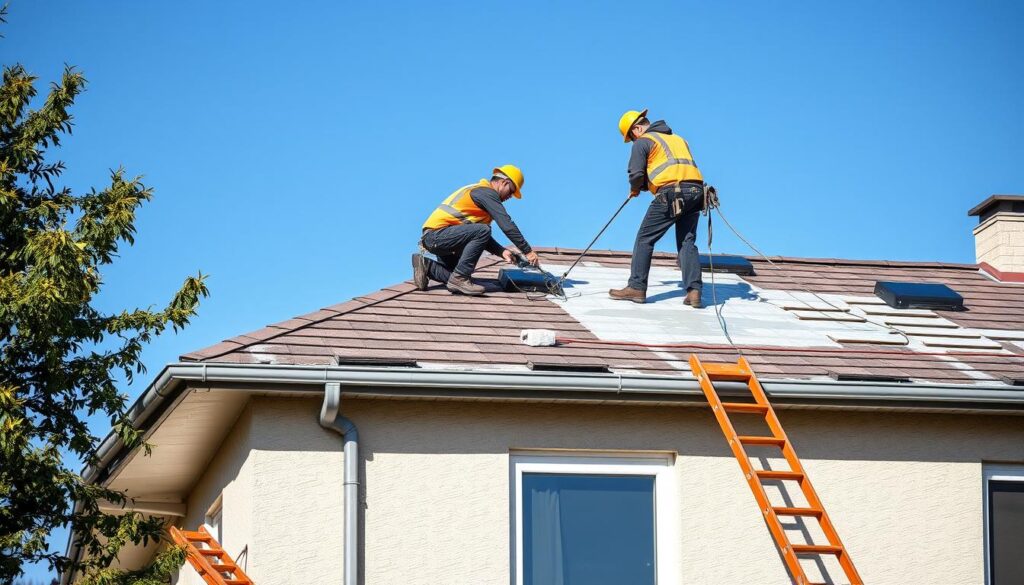
Gauteng shows wide bands. Johannesburg usually ranges from R140–R500 per square metre depending on the system and scope. Sandton often sits at the premium end because of higher labour and access charges. Pretoria and Centurion tend to track slightly lower medians.
Western Cape overview
Coastal exposure and winter rains push us to UV‑stable, storm‑resistant materials. Expect seasonal uplifts of 15–20% during wet months and occasional off‑season discounts up to 10%.
KwaZulu‑Natal trends
Durban, Richards Bay and Empangeni mirror big‑city ranges, but humidity and salt air mean we specify corrosion‑resistant membrane detailing more often. That can nudge costs higher for durable solutions.
Eastern Cape, Free State and the Greater Johannesburg corridor
Gqeberha, East London and Bloemfontein usually sit inside national bands, though travel and access can widen the range. Suburbs across the Greater Johannesburg corridor track Johannesburg medians closely because contractor density keeps pricing competitive.
| Region / City | Indicative band (R per square metre) | Common drivers | Seasonal uplift |
|---|---|---|---|
| Gauteng (Johannesburg, Sandton, Pretoria) | R140–R500 | Labour, access, premium locations | ±0–10% (Sandton higher) |
| Western Cape (Cape Town, Strand) | R160–R480 | UV, storm exposure, material choice | +15–20% (winter) |
| KwaZulu‑Natal (Durban, Richards Bay) | R150–R450 | Humidity, corrosion resistance, membrane spec | +10–15% (rainy season) |
| Eastern Cape / Free State & Corridor suburbs | R140–R420 | Access, travel time, local stock levels | ±0–10% |
Quick guidance: factor site complexity—height, parapets and penetrations—when you compare quotes. Ask local contractors about weather windows and material lead times so your selected services match the project requirements.
Waterproofing systems and what they cost per square metre – Roof Waterproofing Cost Per Square Meter in South Africa
Different systems suit different building types; we map those matches to realistic pricing bands so you can shortlist fast.
Torch-on bitumen membranes
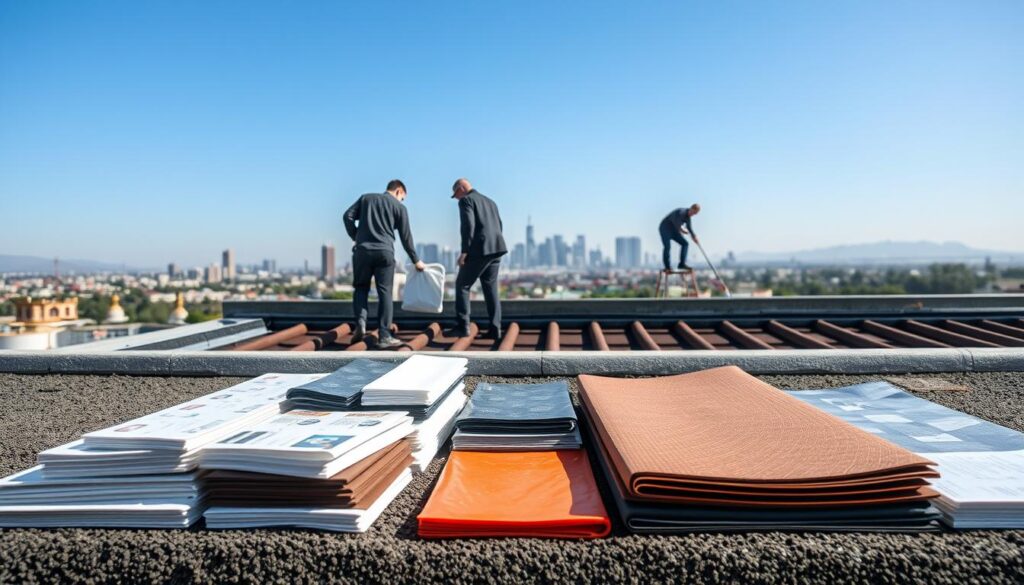
Typical pricing: R300–R400 per square metre (some projects see R200–R400).
These membranes are durable and weather‑resistant with good UV and standing‑water resistance. They often carry 8–10 year warranties and suit flat roofs and parapet junctions well.
Liquid-applied coatings (including cool roof options)
Typical pricing: R140–R400 per square metre; cool roof liquids range R180–R500.
Liquids create seamless coverage and excel around complex details and penetrations. They need skilled application and periodic re‑coating to maintain warranties of about 5–10 years. Cool finishes can reduce surface temperatures and lower thermal movement, justifying higher R500 per square upper bands on the right projects.
Single-ply membranes
Typical pricing: R280–R350 per square metre for commercial and refurbishment work.
Single‑ply systems install quickly, require low maintenance and commonly carry 15–20 year warranties. They are ideal for large footprints and tight programmes.
| System | Indicative pricing | Pros | Cons / Warranty |
|---|---|---|---|
| Torch‑on bitumen | R300–R400 (R200–R400) | Durable, proven resistance to weather, good for parapets | Skilled install; 8–10 years |
| Liquid‑applied (standard) | R140–R400 | Seamless, flexible at details, adaptable to shapes | Re‑coating may be needed; 5–10 years |
| Cool roof liquid | R180–R500 | Energy savings, reduces thermal movement | Higher upfront pricing; payback via energy; 5–10 years |
| Single‑ply membrane | R280–R350 | Fast install, low maintenance, long warranties | Upfront material quality matters; 15–20 years |
Practical notes: Check substrate compatibility—concrete slabs and screeds need priming and repairs before any system is applied. Request brand data, thickness and test certificates so quality beats headline pricing.
Installation tip: schedule liquids for dry weather windows; torch‑on tolerates cooler conditions but still needs suitable access and safety measures. Matching the system to exposure and programme saves money over the life cycle.
Key factors that drive waterproofing costs – Roof Waterproofing Cost Per Square Meter in South Africa
Understanding what pushes a quote up or down makes comparing proposals much easier.
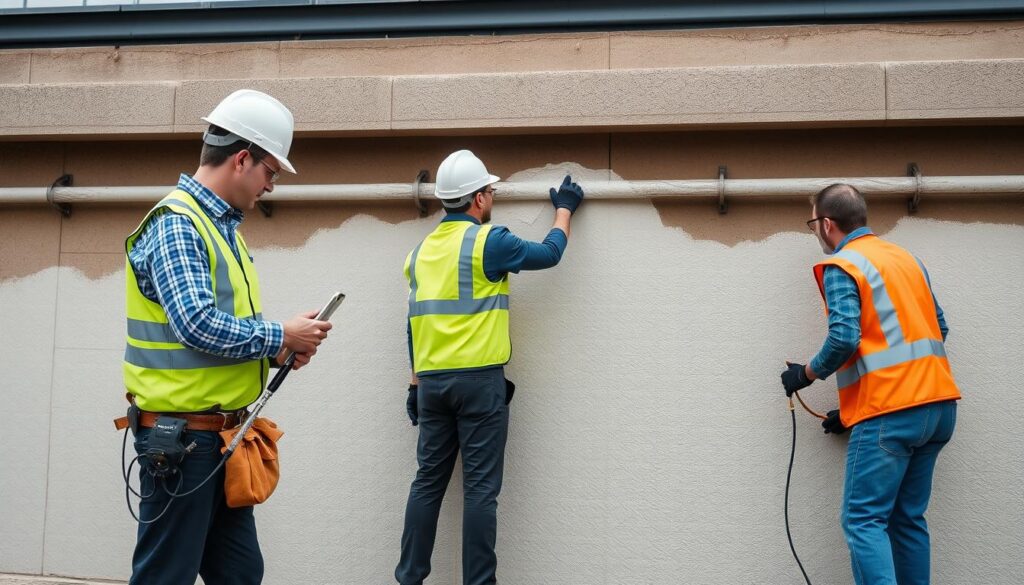
Surface preparation, access and complexity
We find that cleaning, repairs, priming and drying times often set the project programme.
Typical small repairs can add between R1,500 and R4,000 to a job. Limited access or the need for scaffolding tightens installation windows and raises labour pricing.
Size, existing damage and roof features
Existing damage and trapped moisture mean extra work. Removing old membrane, patching concrete and detailing around skylights, vents or chimneys increases hours and the final per square rate.
Material quality, labour rates and seasonal shifts
Materials range from cementitious products to high‑grade polyurethane and bitumen systems. Higher‑spec items cost more but extend service life and strengthen warranties.
Labour for complex jobs can range R120–R450 per m², with a common average near R160 per m². Seasonality can add 15–20% during wet months; off‑season planning can save up to 10%.
| Factor | Typical impact | Why it matters |
|---|---|---|
| Surface preparation | R1,500–R4,000 (small jobs) | Ensures adhesion and warranty validity |
| Access & complexity | Higher labour rates, scaffolding costs | Limits installation windows and safety needs |
| Materials & specification | Low to high grade options | Determines longevity and warranty length |
| Seasonality | +15–20% (peak) / -10% (off‑season) | Weather affects application and demand |
- We advise noting site constraints in your brief so quotes match the true scope.
- Check membrane adhesion and concrete compatibility before you accept a price.
- Size matters: larger areas usually achieve better per square metre rates due to scale.
Budget planning: typical scenarios and allowances – Roof Waterproofing Cost Per Square Meter in South Africa
Good budgeting starts with clear bands for materials, labour and access so you can set a realistic allowance early.
We list planning bands by type so you can size a project budget quickly. Metal runs R95–R220 per square metre, tiled R125–R230 and flat roofs R295–R480. Labour averages near R160 per square metre but varies with access and complexity.
Contingency and when to use it
Allow 10–20% extra for hidden damage, flashing replacement or weather delays. We use 15% in the worked examples below to illustrate likely outcomes.

Example project budgets by area and system
| Area (m²) | Torch‑on (core) | Liquid (core) | Single‑ply (core) | Total with 15% contingency |
|---|---|---|---|---|
| 30 | R9,000 | R4,800 | R8,400 | R10,350 |
| 60 | R18,000 | R9,600 | R16,800 | R20,700 |
| 100 | R30,000 | R16,000 | R28,000 | R34,500 |
| 150 | R45,000 | R24,000 | R42,000 | R51,750 |
| 200 | R60,000 | R32,000 | R56,000 | R69,000 |
- Build a line for access and preparation on top of the core rate so quotes are realistic.
- Phase larger projects if access or staging reduces the per square price overall.
- Ask suppliers for itemised quotes, including R400 per allowances for specified primers and repairs.
How we suggest comparing quotes and choosing the right contractor – Roof Waterproofing Cost Per Square Meter in South Africa
Make comparison simple: insist every offer uses the same materials list, application rates and coverage so you can see real differences at a glance.
Request itemised, like‑for‑like proposals. Ask for a clear breakdown of materials, labour, access and installation methods. Require a per square line for each system and note any exclusions.

Credentials, references and warranties to check
Vet contractors thoroughly. Confirm licences, insurance and recent projects nearby. Call referees and ask about site supervision and finishing quality.
Insist on written warranties covering materials and workmanship. Read terms for duration, exclusions and maintenance requirements so you know what is actually protected.
Practical checklist and comparison table
| Item | What to expect | Why it matters |
|---|---|---|
| Materials | Brand, spec, thickness | Determines longevity and quality |
| Installation | Method, crew, access plan | Affects programme and final finish |
| Warranties | Length and scope | Protects your investment |
- Get at least three quotes and flag any unusually low bids.
- Compare like‑for‑like and score each proposal on quality, timelines and risk.
- Request product data sheets and test results to verify performance claims.
- Agree change management: how variations are priced and approved.
“Clear specs and a simple comparison table save time and protect value.”
The installation process, timelines, and warranties – Roof Waterproofing Cost Per Square Meter in South Africa
We guide you through the practical steps contractors follow from site preparation to final sign‑off.
Typical sequence: surface cleaning and repairs; priming; installation of the chosen system (torch‑on, liquid or single‑ply); detailing around penetrations and terminations; inspection and final sign‑off.
Timeline varies by system. Liquids need dry weather and curing time. Torch‑on takes skilled hot‑works and safe heat control. Single‑ply installs faster and often shortens programmes.
We emphasise quality controls. Check that crews test adhesion, protect finishes and document work. Agree inspection points and sign‑offs so standards are verifiable.
Warranties and maintenance: expect liquids 5–10 years, torch‑on about 8–10 years and single‑ply 15–20 years, subject to simple upkeep. Carry out visual checks every 2–3 years and clear debris after storms to keep cover valid.
| Step | Typical time | What we check | Owner action |
|---|---|---|---|
| Preparation | 1–3 days | Clean, repairs, dry | Approve scope |
| Priming | Half‑day | Coverage, product sheet | Keep product data |
| System install | 1–7 days | Seams, penetrations, cured | Agree inspection |
| Final sign‑off | Half‑day | Documentation, warranties | Collect paperwork |
Quick checklist: confirm weather windows, retain product data sheets, log inspections and budget modest maintenance costs. Small checks save larger repairs and protect the initial investment per square and over each square metre.
Roof Waterproofing Cost Per Square Meter in South Africa: Conclusion
Conclusion
We pull together the main pricing bands and practical checks so your next decision is confident and efficient.
Use the national bands (R140–R500 overall; torch‑on R300–R400; liquids R140–R400, cool‑roof up to R180–R500; single‑ply R280–R350) and the labour guide (~R160) to benchmark quotes and set a sensible budget. Expect seasonal swings of 15–20% and plan a 10–20% contingency for hidden damage and repairs.
Choose solutions that match surface condition and long‑term goals, insist on itemised proposals and warranties, and shortlist contractors who meet standards and communicate clearly. Small planning steps — timing, access and material lead times — often improve pricing and durability.
We aim to help you make informed decisions using the tables above to compare cities, types and practical budgets before you request like‑for‑like proposals.
FAQ – Roof Waterproofing Cost Per Square Meter in South Africa
What influences expert roof waterproofing cost per square metre across provinces and major cities?
Several factors shape pricing. Surface preparation and access difficulty increase labour time. Existing damage, roof features such as skylights or chimneys, and the size of the job alter material and labour needs. The choice of system — torch‑on membranes, liquid‑applied coatings, or single‑ply membranes — changes material spend and warranty levels. Regional labour rates and seasonal demand also affect quotes, so we always compare local suppliers and installers.
How do we help you make informed decisions when comparing quotes?
We recommend asking for itemised, like‑for‑like proposals that list materials, labour, surface preparation, warranty length and exclusions. Check credentials and recent references, verify compliance with South African standards, and confirm whether testing or moisture surveys are included. We suggest budgeting a 10–20% contingency for unexpected repairs found during strip‑out or preparation.
What are national price ranges for typical, low and high projects right now?
Typical prices vary by system and complexity. Low‑end basic repairs or simple coatings start at modest rates, while comprehensive membrane renewals with high‑grade materials and extensive prep sit at the upper end. Seasonal demand and site access push prices up or down. For accurate planning, request recent, localised quotes rather than relying on nationwide averages.
What should be included in a quote and what are common extras to watch for?
A good quote lists scope, materials (brand and specification), labour hours, site preparation, waste disposal, testing, and warranty terms. Extras often include scaffold or crane hire, extensive substrate repairs, insulation replacement, flashings and detail work, and after‑care treatments. Clarify whether guarantees are conditional on annual maintenance.
How do regional prices differ — for example Gauteng, Western Cape and KwaZulu‑Natal?
Urban centres with higher labour costs and demand — such as Johannesburg and Cape Town — generally show higher rates. Coastal areas may require corrosion‑resistant solutions, influencing material choice and price. Inland cities can have lower labour rates but sometimes higher logistics costs for specialised membranes. We always compare specific city quotes to understand local drivers.
Are there notable differences within the Greater Johannesburg corridor and other metropolitan clusters?
Yes. Suburbs and industrial zones differ in access, site constraints and contractor competition. Areas like Sandton or Fourways can command higher rates due to demand and complex buildings, while industrial pockets may benefit from competitive commercial pricing. For precise budgeting, get quotes for the exact suburb or business district.
Which systems tend to be most economical versus premium?
Cost varies by system: basic coatings are usually the most budget‑friendly, torch‑on bitumen membranes sit in the mid range and single‑ply membranes are often pricier for commercial work. Premium costs reflect long warranties, superior UV resistance and better thermal performance. Choose based on durability needs and long‑term value rather than upfront price alone.
When should we choose torch‑on bitumen, liquid‑applied coatings, or single‑ply membranes?
Torch‑on membranes suit pitched or detailed areas needing durability; liquid coatings work well for complex shapes and simple repairs and can offer cool‑roof options; single‑ply membranes are common for commercial refurbishments with large, even surfaces. Consider substrate condition, traffic and expected lifespan when choosing.
How much does surface preparation and complexity add to a quote?
Significantly. Stripping old layers, repairing concrete spalls, replacing insulation or detailing around penetrations can add material and labour time. Difficult access or restricted working hours also increases cost. We advise including a site inspection to quantify preparation needs before accepting a fixed price.
What allowances should we include for different roof types — flat, metal, tiled?
Flat roofs often need full membrane solutions and more preparatory work. Metal roofs may need specialised coatings or seam repairs; tiled roofs require sealing and possible re‑bedding or tile replacement. Each type has typical price bands; plan for higher allowances when substrates show age or prior patch repairs.
How do warranties and maintenance affect long‑term value?
Longer warranties usually indicate higher material and workmanship standards but may require scheduled maintenance to remain valid. Insist on written warranty terms, understand exclusions and ask whether the installer offers maintenance services. Regular inspections and minor upkeep extend performance and protect your investment.
How should we add contingency to a project budget?
We suggest a 10–20% contingency for uncovering hidden defects, weather delays, or additional detailing. For older buildings or those with known water ingress, err on the higher side. Contingency helps avoid compromises that can raise lifetime repair needs.
What questions should we ask contractors to ensure like‑for‑like comparisons?
Request itemised lists of materials by brand and specification, labour breakdown, preparation steps, warranty duration and scope, and timelines. Ask for references, proof of compliance with local building standards, and confirmation of who handles site safety and waste removal. We also check whether testing or moisture surveys are included.
How long does installation typically take and what are common timelines?
Timelines depend on system, area size and preparation needs. Small patching or recoating jobs can take a day or two, while full membrane replacements for medium to large areas can take several days to weeks. Weather and access can extend schedules, so allow flexibility when planning.
Can we get a table of indicative price bands by system and city for planning?
We can provide a tailored table after a brief site description. Indicative bands vary widely with local factors and seasonality, so we prefer to compile a short list of likely systems and regional ranges once we know the city, roof type and expected scope.
How do seasonal fluctuations affect availability and pricing?
Demand rises in drier months, which can push labour rates up and extend lead times. Rainy seasons limit work windows and may increase remedial steps. We recommend scheduling in advance for peak periods and choosing flexible installers who plan for weather interruptions.
What combined services should we consider when getting quotes?
Look for suppliers who offer moisture surveys, detailed condition reports, thermal or infrared diagnostics, and after‑care maintenance packages. Bundling testing and installation often saves time and ensures the system suits the substrate and exposure conditions.
How do material quality and brand selection impact pricing and performance?
Higher‑grade membranes and reputable brands usually cost more but deliver longer life and better warranties. Cheap materials may lower initial spend but raise long‑term repair needs. We prefer proven brands and insist on matching the product specification to the building’s exposure.
What steps do we recommend before accepting a final quote?
Verify scope, confirm exclusion items, check warranty terms, ask for start and completion dates, request client references and ensure insurance and compliance certificates are provided. A short pre‑start inspection by the contractor helps finalise an accurate, binding price.

